Infographics
Infographics are a great way to absorb large, often complex, sets of data. At Bryan & Armstrong we use infographics to help you quickly understand some of the large data sets of health and safety data that are available from places like HSE.gov.uk.
HSE Fatal Injury Statistics 2014/15
This infographic has been created to highlight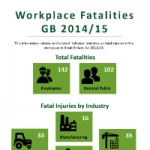 the current status of fatal injuries in the UK workplace and abroad.
While the UK remains one of the safest places to work in the world, accidents still happen and every death is a tragedy.
HSE Health and Safety Statistics 2014/15
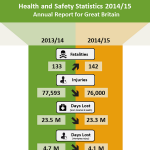 This infographic has been created from the UK Health and Safety Executive’s a to highlight the current status of health and safety statistics in the UK workplace.
This year there has been an increase in workplace fatalities and health related factors have resulted in 99% of workforce absence.